Lighthouse
Siebel - Performance Tuning Made Easy
Are you tired of struggling with...
Limited visibility, inefficient processes, lack of collaboration, inaccurate forecasting, and limited insights?
Analyze
An In-dept analysis is a critical part of solving performance issues. eWorks Lighthouse can help ensure that you get a full picture of the possible causes for potential performance issues and helping with solving them quickly and with little effort.

Track
eWorks Lighthouse application will track the system 24/7 and notify about any issue, outside of the benchmark declared. This way you get all-day tracking system that filters any issues that are not supposed to be treated.
Visibility
eWorks lighthouse is presenting all data in Siebel Language and objects names, making it easy for Siebel developers and analysts understand better how to approach performance issues

Focus
The most important part in resolving performance issues is Focus! You need to concentrate ONLY on the items that need attention and not occupy yourself with hundreds of false/inaccurate complaints. eWorks Lighthouse will help you priorities the important tasks to be issued first.

Team Engagement
With eWorks Lighthouse, you can assign each team a different report in-regards to their responsibility. Performance improvement requires different kind of teams (IT/DB/Business) to help improve complex business process performance issues.
Help your teams work more efficiently and Produce stunning Results
Simplify your performance improvement process with real
time analysis dashboard, error tracking, DB, Infrastructure
and Siebel Servers performance Logs
Using Dashboards
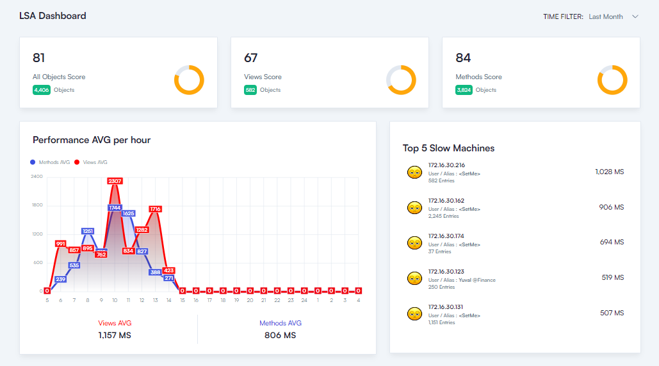
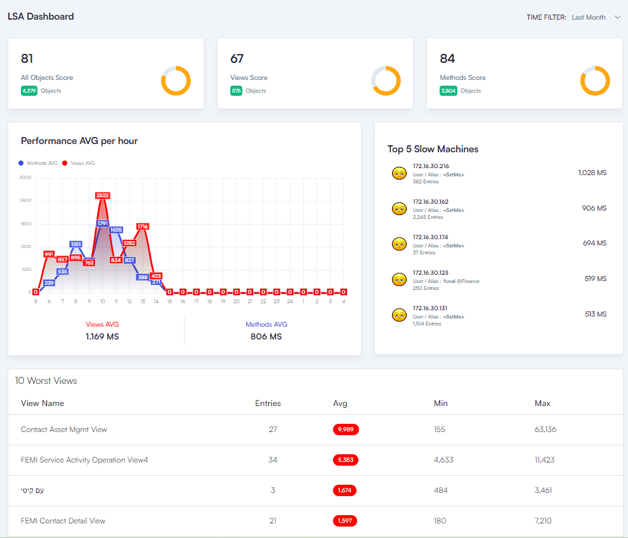
The Dashboard can give you elaborated info about Siebel Views and Methods (User Experience). In Addition, you get information about Slow Workflows, Business Services and SQL queries (Oracle / SQL Server).
All of this information is also presented throughout the day (You can see the hourly changes of each component. You also get a general grade for the system health and if the grade is better than before you can tell the system works better.
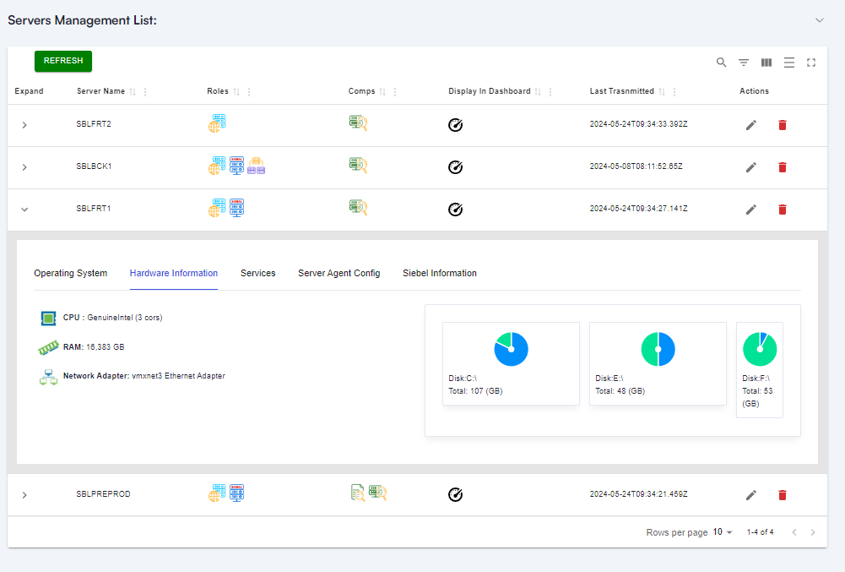
Some more screens are available for tracking infrastructure.”
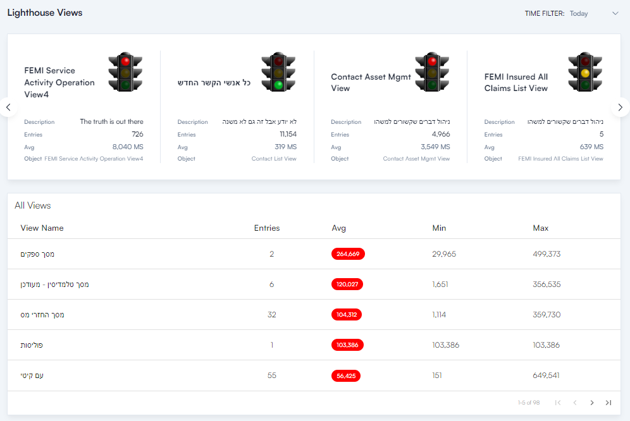
The User Experience Views
Have a glance at the worst Siebel Views and Worst Methods being operated by the user. Here you can see the amount of hits for each View/Methods and the time it took. In Addition, you can add your favorite Views/Methods which will be visible at all times at the top of the screen
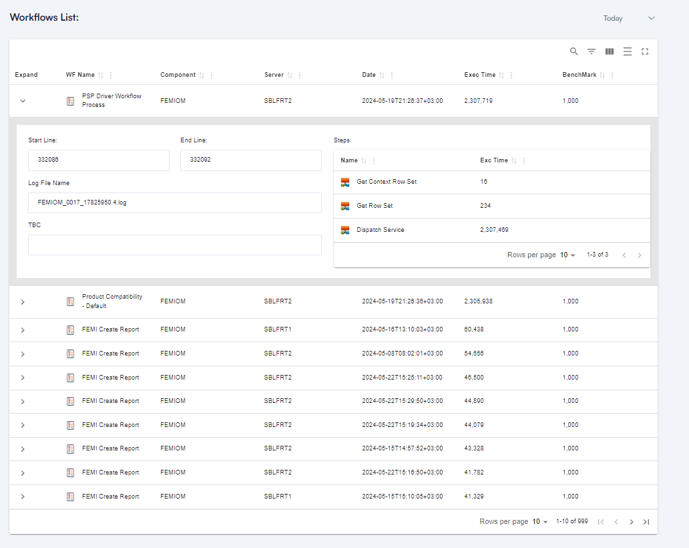
The Server Experience Views
In the Server Experience views you get an analyzed grouped report on System Errors, Slow SQL’s, Slow Business Services and Slow Workflows. eWorks Lighthouse further locates the problematic parts of each WF and presents it to the user. In Addition, you can track each occurrence and have a detailed Log for the incident to further investigate in case of need.
Exploring Infrastructure
Our Clients
“Before installing the eWorks Lighthouse Application, we were losing between 3-5 Job positions to the lagging screens and poor performance. Since installing the App and correcting the issues raised, we improved our capacity by 30%”
“We were about to replace the entire project due to heavy performance Issues. After a full year of having top consultants who did not help, eWorks Lighthouse App changed it all. Can’t say what we could do without it”
35%
20%
“Being a Multi-National organization, working with eWorks Lighthouse, Saved us numerous flights and roughly 20% of our projected expenses on maintenance.
Get the most out of your Oracle Siebel Resources
